 Find a calculator ↗
Inventory Carrying Cost: Build an Annual Estimate Without Double Counting
Inventory carrying cost estimates the annual cost of holding stock. It includes more than warehouse rent: money tied up in products, allocated support costs, and expected losses can all affect the economics of keeping inventory.
Use this guide as a worksheet: establish the inventory value, map the cost buckets, then test which expenses would actually change under a different stock plan.
Start with an inventory-cost worksheet, not a borrowed percentage
A carrying-cost percentage is the result of several assumptions. Copying a percentage from another business skips the most useful work: finding out which costs your stock actually creates.
Set up a worksheet with one row per expense. Add columns for the annual amount, the inventory group it supports, the allocation method, and the source of the figure. Mark each row as measured, allocated, or estimated.
| Question | What to record |
|---|---|
| Which stock is covered? | Warehouse, product group, ownership, and reporting period. |
| How was average value calculated? | Snapshot frequency and inventory-at-cost basis. |
| Where did each expense come from? | Invoice, contract, internal allocation, or explicit assumption. |
| Could the expense change? | Immediately variable, fixed for now, or dependent on a larger change. |
This makes the model easier to challenge. If someone questions the storage figure, you can discuss the space allocation rather than arguing about whether a headline rate “looks right.”
Separate the annual view from the next-order decision
An annual carrying estimate describes a stockholding pattern over a year. A decision to buy one extra batch has its own quantity, arrival date, and depletion schedule. The annual percentage can inform that decision, but it should not replace the schedule.
Use average stock value at cost
The starting value is the money invested in inventory, not its expected retail selling price. A retail markup does not mean more cash was invested in buying the same stock.
A simple opening-and-closing average can be useful when stock levels are stable. If inventory rises sharply before a busy season, use more frequent snapshots so the average reflects the period more fairly.
Keep the inventory population consistent. If the cost estimate covers one warehouse or product group, use the average stock value for that same group.
Separate the four cost buckets
| Bucket | Examples | Main check |
|---|---|---|
| Capital | A chosen rate applied to average inventory investment | Document the rate and what it represents. |
| Storage and handling | Allocated space and inventory-holding effort | Avoid adding the same labor twice. |
| Insurance and administration | Relevant coverage and support costs | Exclude items already assigned to storage. |
| Risk | Expected shrinkage, deterioration, or obsolescence | Use a supported estimate at inventory cost. |
Capital cost can represent a financing expense or an opportunity-cost assumption. These are not automatically interchangeable. Explain the approach you are using rather than combining overlapping rates.
This guide is a management planning model. It does not decide which expenses belong in inventory valuation or how losses should be recorded in your accounts.
A seasonal stock build can make a two-point average misleading
Suppose inventory snapshots at four equally spaced quarter-ends are $100,000, $300,000, $300,000, and $100,000. Their simple average is $200,000. Using only the first and last of those snapshots would give $100,000 and miss the larger middle-of-year stockholding.
More snapshots are not automatically better if they are taken inconsistently. Use a repeatable schedule and understand what it represents. If stock changes sharply within a month, month-end observations may still miss the peak.
When intervals differ, a time-weighted approach may be more suitable. A balance held for three months should not receive the same weight as one held for a week. The goal is to approximate the investment held over the period, using information your business can support.
Document whether goods in transit, consigned stock, and stock held at another location belong in the population. The important point for this planning model is consistency between the inventory value and the costs assigned to it; ownership and accounting treatment need their own review.
Worked example: $200,000 of average inventory
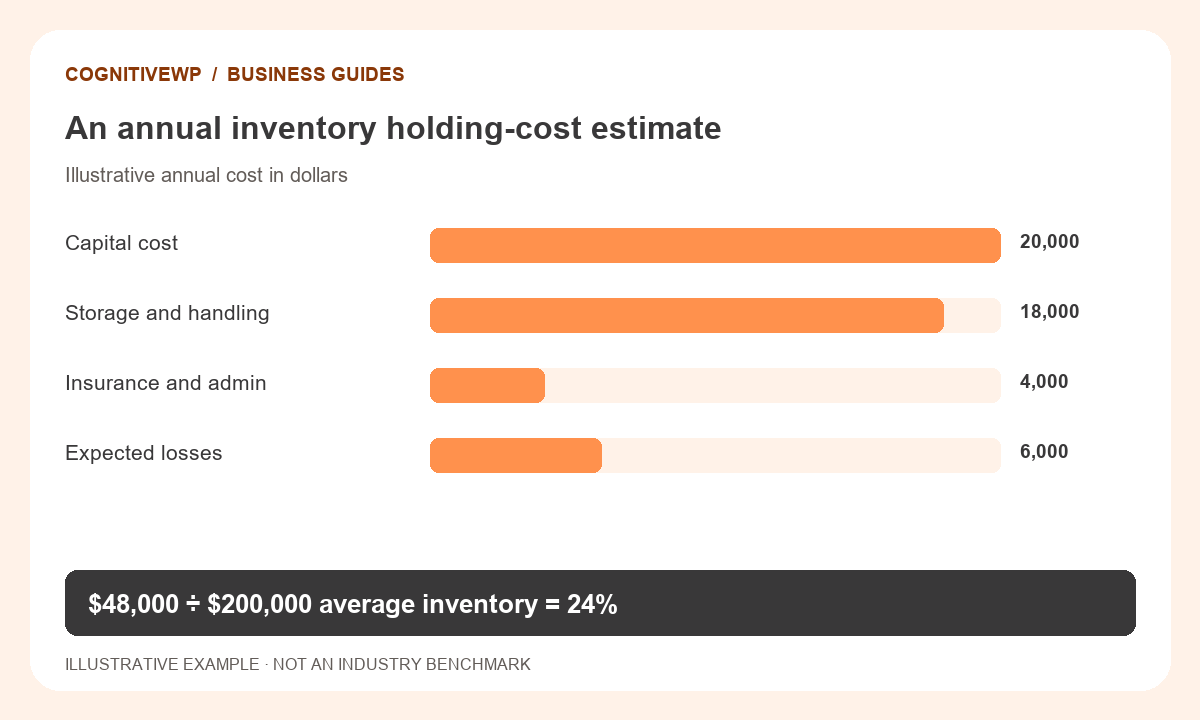
Assume average inventory at cost is $200,000. The planning capital rate is 10%, annual storage and handling is $18,000, insurance and administration is $4,000, and the expected loss rate is 3%.
- Capital cost: $200,000 × 10% = $20,000.
- Expected losses: $200,000 × 3% = $6,000.
- Annual total: $20,000 + $18,000 + $4,000 + $6,000 = $48,000.
- Carrying rate: $48,000 ÷ $200,000 × 100 = 24%.
The monthly average is $4,000, but this is an annual estimate divided by 12—not a prediction that every month will incur exactly the same costs.
All rates here are illustrative. They are not industry benchmarks or recommended assumptions for your business.
A second example: does a bulk discount cover the extra holding cost?
Assume a larger order saves $1,500 on purchase price. It creates an extra $50,000 of stock that is expected to decline evenly to zero over six months. For a simplified comparison, average extra inventory during those six months is $25,000.
Use the base example’s combined capital and loss assumptions of 13% per year. Incremental capital and risk cost is $25,000 × 13% × 6/12 = $1,625. That already exceeds the $1,500 purchase saving by $125, before any additional storage, handling, or delivery effects.
This is not the same as applying the full 24% carrying rate to $50,000 for an entire year. That would assume both a different stock pattern and a different cost response.
The simplified depletion pattern also matters. If most of the stock remains unsold until the final month, average investment will be higher. If it sells quickly, it will be lower. Sketch the expected stock balance before applying an annual rate.
Use the Bulk Purchase Discount Calculator for its stated comparison, then review the holding schedule separately if your actual purchase pattern is more complex.
Distinguish assigned cost from avoidable savings
If average inventory falls, some costs may fall with it. Others may remain unchanged. You may still pay the same warehouse lease after removing a few pallets.
For the example above, reducing average inventory by $50,000 would reduce the modeled capital and risk amounts by $6,500 at the same 10% and 3% rates. It does not automatically remove one quarter of the warehouse rent or administration cost.
An allocated cost is not always an immediately avoidable cost. Before claiming savings, identify the contract, staffing, or space change that would actually reduce spending.
Use the estimate to evaluate purchasing choices
A bulk discount can lower purchase cost while increasing the stock you hold. Compare the discount with incremental holding cost over the expected holding period, not just the annual carrying rate in isolation.
- Check whether extra stock is likely to sell before it becomes obsolete.
- Include changed ordering or freight costs where relevant.
- Review space limits and cash availability.
- Keep service-level and stockout consequences in view.
Refresh the estimate when inventory value, storage arrangements, or loss experience changes. A simple documented model is more useful than a precise percentage whose inputs no one can explain.
Translate the estimate into actions that can change a cost
Sort proposed savings into three groups. First are costs that move directly with stock value under your model, such as the capital assumption. Second are spending changes you can identify, such as giving up paid overflow space. Third are allocations that may stay unchanged.
Assign an owner and a date to each proposed spending change. If a warehouse lease cannot change this year, reducing an allocation in a spreadsheet will not reduce the invoice this year.
- Review slow-moving stock separately from inventory needed to maintain service.
- Check whether smaller orders would increase freight or ordering effort.
- Track the reason for expected losses rather than relying only on a broad percentage.
- Compare the revised stock plan with delivery reliability and replenishment timing.
A lower inventory balance is not automatically the best outcome. The useful decision is the one that balances a supported cost estimate with the operating consequences of holding less stock.
Frequently asked questions
Should I use retail value or purchase cost?
Use inventory value at cost for this model. Keep the value basis consistent with the loss and capital assumptions.
Is a carrying rate the same as a loan interest rate?
No. Carrying cost also includes storage, service, and risk costs. The capital component may use a financing or opportunity-cost assumption.
Can I multiply the rate by extra stock to estimate savings?
That can be a rough allocation, but it may overstate cash savings when storage and other costs remain fixed. Review which costs would actually change.
How should seasonal inventory be averaged?
Use multiple snapshots across the year when two endpoints would miss a seasonal build-up. Apply the same method when comparing periods.
What if average inventory is zero?
A carrying percentage cannot be calculated with a zero denominator. Review whether the annual costs and inventory period belong together.
Related calculators and category
Find a tool for your next business decision
Explore free calculators to compare costs, capacity, and planning assumptions.