 Find a calculator ↗
Price Increase Break-Even Churn: How Much Customer Loss Offsets a Higher Price?
Price increase break-even churn estimates how much one-time customer loss would leave recurring revenue unchanged after a price increase. It is a scenario calculation for a comparable customer group, not a prediction of how customers will respond.
A revenue boundary is a starting point, not permission to raise prices
The break-even percentage answers a narrow question: how many customers could leave while the remaining customers, paying the new price, produce at least the old monthly revenue? It does not answer how many will leave or whether the change is right for the product.
Keep those questions separate. First calculate the boundary. Then use customer evidence, renewal arrangements, service economics, and operating constraints to evaluate the proposed change.
In the $50-to-$60 example, a manager might summarize the result as “we can lose roughly one customer in six.” That shorthand is easy to misuse. It leaves out whole-customer rounding, discounts, delayed renewals, and the possibility that the customers who leave have different economics from those who stay.
Use the threshold as a stress test. Ask which assumptions would move actual revenue below it, rather than treating it as an acceptable loss target.
Define the customer cohort first
Use customers on the same price plan or a group for which one price is a reasonable representation. A mixture of enterprise contracts, discounted accounts, and small plans usually needs separate cohorts.
The simple model assumes retained customers move to the proposed price. It does not account for grandfathered pricing, phased renewals, negotiated discounts, or downgrades unless you model them separately.
Choose one currency and one billing period. Comparing a monthly price with an annual total will produce a meaningless threshold.
Understand what the break-even threshold means
Before the change, revenue equals customer count multiplied by old price. After the change, revenue equals retained customer count multiplied by new price. Set those values equal and solve for the retained share.
The retained share is old price ÷ new price. The loss share is one minus that amount. This is why a 20% price increase does not imply that you can lose 20% of customers without reducing revenue.
The threshold protects revenue in this simplified scenario, not profit or customer trust. Costs, service load, future expansion, and reputation are outside the calculation.
Three situations where one average price is not enough
1. Customers move at different times
Annual contracts may renew throughout the year. If only some customers move to the new price this month, do not apply the new price to the whole customer count. Split the cohort into customers still at the old price and customers who have actually moved.
2. Some customers receive a concession
A temporary discount or negotiated price can keep an account while reducing the expected increase. Count that account at the price it will actually pay, not the headline list price.
3. Customers change plans instead of canceling
A retained account that downgrades can reduce revenue without appearing in customer-loss statistics. Track cancellations and contraction separately. A logo-retention figure alone will not capture the full price-change outcome.
For each group, calculate retained customers multiplied by the applicable recurring price, then add the group totals. Keep one-time fees and credits separate if the question concerns recurring revenue. This takes more work than a single average, but the result is much easier to explain.
Worked example: increasing $50 to $60
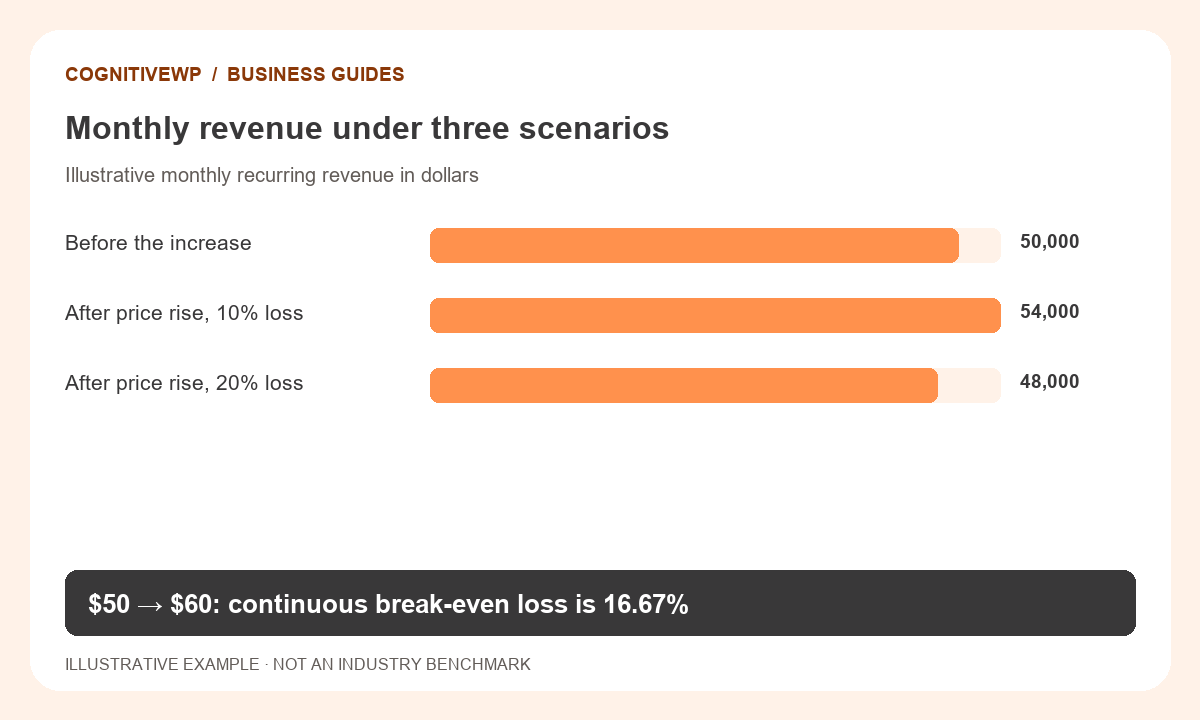
| Scenario | Customers retained | Monthly revenue |
|---|---|---|
| Before change | 1,000 at $50 | $50,000 |
| 10% loss | 900 at $60 | $54,000 |
| 20% loss | 800 at $60 | $48,000 |
The continuous break-even loss is (1 − 50 ÷ 60) × 100 = 16.6667%. But customers are whole people or accounts. To preserve at least $50,000, you need to retain the ceiling of 1,000 × 50 ÷ 60: 834 customers.
That allows a maximum whole-customer loss of 166, or 16.6%, in this example. Retaining 833 would produce $49,980, slightly below the original revenue. Do not round the threshold upward and describe it as safe.
A second example: concessions can consume the apparent headroom
Start with 1,000 customers paying $50, producing $50,000 per month. After the proposed increase, 900 customers remain. In the simple scenario, all 900 pay $60 and produce $54,000.
Now add a realistic complication: 200 of those retained customers remain at $50 for the period being reviewed. The other 700 pay $60.
| Group | Calculation | Monthly revenue |
|---|---|---|
| Customers on the new price | 700 × $60 | $42,000 |
| Customers still on the old price | 200 × $50 | $10,000 |
| Total retained cohort | 900 customers | $52,000 |
Customer loss is still 10%, but the increase in monthly revenue is $2,000 rather than $4,000. The difference is not an arithmetic error; the all-customers-pay-the-new-price assumption no longer holds.
If additional customers downgrade, add a separate row at their new price. If renewals move later than expected, change the timing of the relevant rows. A simple revenue bridge makes these effects visible without pretending the one-rate calculator models every situation.
Separate one-time loss from monthly churn
The scenario’s loss percentage is the cumulative customer loss associated with the modeled price change. It is not an ongoing monthly churn assumption.
Applying 10% customer loss every month produces a very different trajectory from losing 10% once. New customers, expansion, contraction, and renewal timing also affect later revenue.
If your goal is a multi-month forecast, build a period-by-period model. Use this threshold as one input to that wider analysis rather than extending a single-month calculation indefinitely.
Test the decision with more than one number
- Segment customers by plan, discount, and renewal timing.
- Run several plausible loss scenarios rather than one precise forecast.
- Compare revenue changes with delivery and support costs.
- Track downgrades and concessions as well as cancellations.
- Review actual outcomes over a defined follow-up window.
Revenue can rise while profit falls if servicing the retained group becomes more expensive. It can also rise initially while longer-term acquisition or retention weakens. The calculator deliberately leaves those effects separate.
Use the result to understand the arithmetic boundary. A pricing decision still needs evidence about customer value, alternatives, communication, and the product experience.
What to monitor after the change
Define the follow-up window before you review results. A snapshot immediately after an announcement will not show the same outcomes as a snapshot after the affected customers have renewed. Keep those stages distinct.
- Exposure: How many customers have actually reached the new price?
- Retention: How many of those customers remain, cancel, or pause?
- Realized price: What recurring amount do retained customers pay after discounts?
- Contraction: How much revenue moves to lower plans or reduced usage?
- Service effort: Does the retained group require a different level of support?
Use a consistent customer identifier and reporting cut-off. Otherwise, a customer who changes plans can accidentally appear as both a cancellation and a new account.
Compare the decision with the evidence available at the time
Save the original scenarios and assumptions. When actual results differ, distinguish a wrong assumption from an unexpected change in conditions. That creates a useful record for the next pricing review.
A before-and-after comparison alone does not establish that the price increase caused every cancellation. Product changes, seasonality, customer budgets, and other events may also matter. Record the reasons you can support and keep unknown causes labeled as unknown.
Finally, revisit profit as well as revenue. The threshold calculation omits delivery cost, payment collection, and future acquisition effects. A pricing plan should explain those limitations before turning a revenue result into a broader business conclusion.
Frequently asked questions
Can a 20% price increase absorb 20% customer loss?
No. Moving from $50 to $60 gives a continuous break-even loss of about 16.67%. Losing 20% would lower revenue in the example.
Why does the calculator round retained customers upward?
Customers are whole units. Rounding upward gives the minimum whole number needed to preserve at least the original modeled revenue.
Is this the same as monthly churn?
No. It models one-time cumulative loss for the price-change scenario. Recurring monthly churn requires a multi-period calculation.
Can I use it for multiple price plans?
Calculate separate cohorts or build a model that reflects each plan and discount. A single average can hide important differences.
Does break-even revenue mean break-even profit?
No. Revenue does not include the full cost of delivering and supporting the service. Analyze profit separately before drawing that conclusion.
Related calculators and category
Find a tool for your next business decision
Explore free calculators to compare costs, capacity, and planning assumptions.