 Find a calculator ↗
Sales Pipeline Coverage Ratio: Match the Pipeline to the Revenue Target
Sales pipeline coverage compares eligible open opportunities with the revenue still needed in a period. It helps reveal a pipeline gap, but the ratio only makes sense when the target, opportunity values, and win-rate definition match.
Your dashboard says 3× coverage. What should you check first?
Start with the opportunities behind the ratio. A pipeline of $900,000 can mean nine plausible $100,000 deals or one large speculative opportunity plus a handful of small deals. The arithmetic is identical; the planning risk is not.
Before asking the team to create more pipeline, check the dates, values, and qualification rules. Otherwise, the easiest way to improve the dashboard may be to add weak opportunities that do not improve the revenue outlook.
| What you see | What to investigate |
|---|---|
| High coverage, repeated misses | Stale opportunities, optimistic close dates, or an unsuitable win rate. |
| Low coverage, strong recent wins | Whether the remaining target and closed-won amounts are up to date. |
| A sudden rise in coverage | New qualified demand versus inflated or duplicated values. |
| Coverage dominated by one deal | How the plan changes if that deal slips or is lost. |
A useful review ends with a specific explanation for the gap. “We need more pipeline” is less actionable than “the current quarter depends on two deals that have not reached the buyer’s approval stage.”
Begin with the amount still needed
If the period target is $500,000 and $200,000 has already been won, the remaining target is $300,000. Comparing open pipeline with the full $500,000 would answer a different question.
Use a consistent revenue basis. Annual contract value, total contract value, bookings, and recognized revenue are not interchangeable. If your target is bookings, do not fill the pipeline column with a different measure.
The reporting period also matters. A large opportunity expected to close next year does not solve this quarter’s gap simply because it appears in the CRM.
Use a win rate that fits pipeline dollars
This guide uses a value-based win rate: won value divided by the total value of comparable resolved opportunities, including won and lost deals. A count-based win rate measures the share of deals won, regardless of size.
Those rates can differ substantially. Winning several small deals and losing one large deal may produce a high deal-count win rate but a much lower value-based rate.
- Use a comparable sales segment and opportunity stage.
- Check that the historical cohort is sufficiently resolved.
- Exclude duplicate or obsolete opportunities.
- Keep opportunity values and target values on the same basis.
Treat historical performance as an assumption, not a guarantee. Changes in pricing, buyers, or sales-cycle length can make an old rate less useful.
How to build a win-rate assumption that belongs in this model
The calculator’s value-based rate should come from a comparable group of resolved opportunities. Record won value and lost value on the same basis used for your pipeline. Then divide won value by their combined value.
For example, if comparable won opportunities total $250,000 and lost opportunities total $750,000, the value-based win rate is 25%. Counting eight won deals and two lost deals instead would produce an 80% count-based win rate. That number cannot explain the revenue outcome when the lost deals were much larger.
Be careful with unfinished opportunities
A recently created cohort may still contain many open deals. Treating them all as losses understates the eventual conversion rate; excluding them without explaining the unresolved share can also distort the picture. Use a sufficiently resolved comparison or state the limitation clearly.
Look at the distribution behind the average. If one large win dominates a small sample, show what happens without that win. The purpose is not to discard inconvenient data, but to see whether one event is driving the planning assumption.
Keep a note of the cohort dates, entry stage, customer segment, and value definition beside the rate. That makes the next review a comparison of methods as well as percentages.
Worked example: a $300,000 remaining target
| Measure | Calculation | Result |
|---|---|---|
| Current coverage | $900,000 ÷ $300,000 | 3.0× |
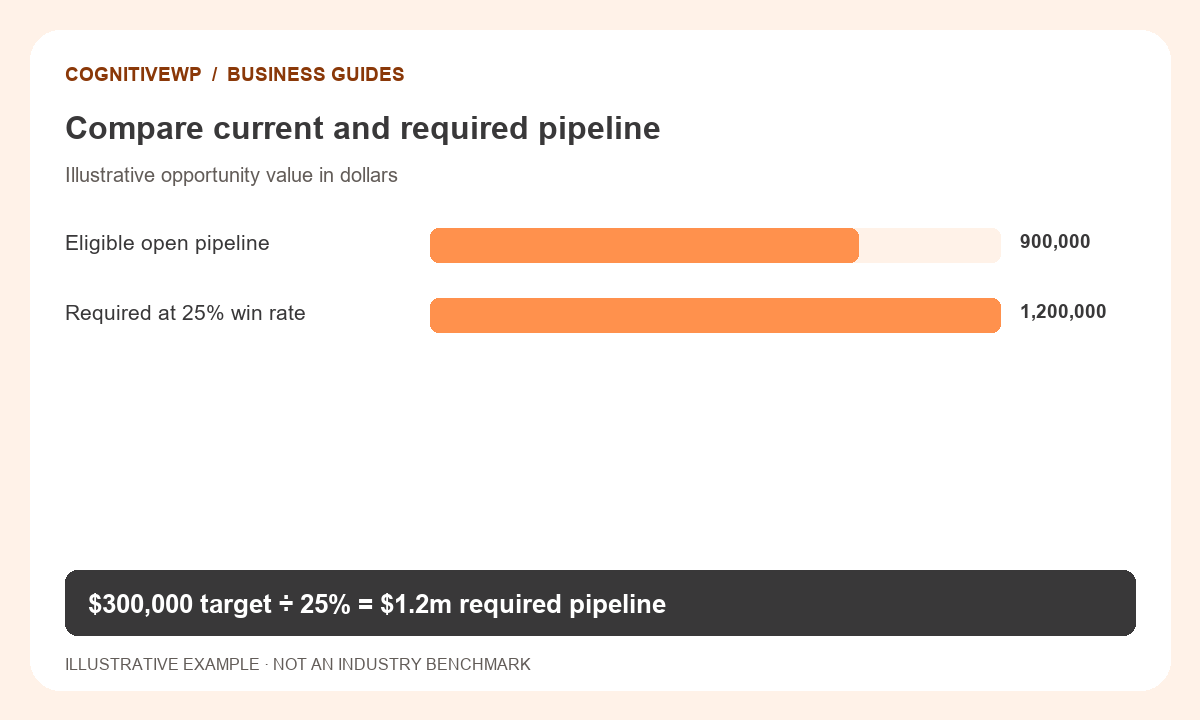
| Required pipeline | $300,000 ÷ 0.25 | $1,200,000 |
| Pipeline gap | $1,200,000 − $900,000 | $300,000 |
| Simple expected value | $900,000 × 0.25 | $225,000 |
At a 25% assumed value-based win rate, the simple model calls for 4.0× coverage. The current pipeline is 3.0×, leaving a $300,000 pipeline-value gap.
That gap is not a $300,000 revenue shortfall. The simple expected-value shortfall is $75,000. These figures describe different quantities, so label them carefully in a dashboard.
A timing and concentration check for the $900,000 example
Return to the $300,000 remaining target and $900,000 eligible pipeline. Now suppose one $400,000 opportunity is pushed outside the reporting period. Eligible pipeline falls to $500,000, giving 1.67× coverage.
At the same 25% assumption, the simple expected value becomes $125,000. Required pipeline remains $1.2 million, so the pipeline-value gap rises to $700,000.
The revised result does not mean the sales team suddenly became less effective. The period definition changed which opportunities could contribute. That is precisely why timing must be checked before celebrating the original ratio.
Separate three questions in the review
- Volume: Is there enough eligible opportunity value under the chosen assumption?
- Timing: Can the relevant opportunities realistically resolve in this period?
- Concentration: How dependent is the plan on a small number of deals?
Do not add a close probability to a deal merely to make the expected total match the target. A deal-level forecast should be supported by what is known about that opportunity, with uncertainty recorded explicitly.
Test the assumption instead of adopting a universal ratio
At a 20% win rate, the same $300,000 target requires $1.5 million of pipeline. At 30%, it requires $1 million. A small change in the assumption materially changes the planning requirement.
This is why “always maintain 3× coverage” is not a complete rule. The useful ratio depends on which opportunities are counted and how reliably similar opportunities convert.
Do not apply the win rate again to pipeline that has already been probability-weighted. That discounts the value twice. Use unweighted eligible pipeline for this calculator, or build a separate forecast with documented stage probabilities.
Turn the gap into an operating plan
- Review near-term opportunities for realistic close dates and next steps.
- Separate missing pipeline from stalled pipeline.
- Estimate what can be created and closed within the period.
- Use conversion assumptions to plan prospecting or meetings.
- Recheck the remaining target as revenue is won.
A pipeline requirement does not prove that the team can generate it in time. Sales-cycle timing, deal concentration, and delivery capacity sit outside this simple ratio.
Keep the coverage model beside a deal-level forecast. One helps assess volume; the other helps explain which opportunities may actually close and why.
Run a useful coverage review in four passes
Pass one: reconcile the target. Confirm the remaining amount after wins, adjustments, and the reporting cut-off. Keep a record of changes so a moving target does not become invisible.
Pass two: clean the pipeline. Remove duplicates from the analysis, review stale dates, and identify opportunities that no longer meet the agreed entry criteria. Preserve your CRM history according to your own process.
Pass three: stress the assumption. Compare a lower, central, and higher win-rate scenario. In the base example, 20%, 25%, and 30% imply required pipeline of $1.5 million, $1.2 million, and $1 million. These are scenarios, not benchmarks.
Pass four: assign actions. Separate opportunity progression from new demand creation. Each needs different work and a different lead time. The SDR Meeting Target Calculator can support a conversion-based activity plan, but it does not remove the time needed to create and close opportunities.
End the review with owners, dates, and assumptions to revisit. The ratio is most useful when it helps the team make those choices, rather than becoming a score that encourages inflated opportunity values.
Frequently asked questions
Is 3× pipeline coverage always enough?
No. In this simple model, a 25% win rate requires 4× coverage. Different stages, segments, and timing assumptions can require different ratios.
Should closed-won deals remain in open pipeline?
No. Remove them from open pipeline and reduce the remaining target by the appropriate won amount. Otherwise you may count the same value twice.
Can I use a deal-count win rate?
Only if it is a defensible approximation for your values. A value-based rate is more consistent when estimating revenue from pipeline dollars.
What if the target is already met?
A zero remaining target makes the ratio undefined. Report that the target is met and track the additional pipeline separately.
Does required pipeline predict actual revenue?
No. It is a planning calculation based on a win-rate assumption. It does not model individual deal timing or guarantee a result.
Related calculators and category
Find a tool for your next business decision
Explore free calculators to compare costs, capacity, and planning assumptions.